Chapter One:
The Superfund Program
The Superfund Program is responsible for the investigation and clean-up of contaminated sites left over from decades of unregulated industrial manufacturing and other activities. The most highly contaminated sites which require longer-term remedial action qualify for the National Priority List (NPL).
In order to qualify for the NPL a site must receive a Hazard Ranking System (HRS) score of 28.5. The sites seen here were extracted from the EPA's Superfund website, and meet the qualifications for the NPL.
But the sites you see here are merely representative points, and toxins from many of these sites have spread far beyond their boundaries. Next we will visit two case studies to explore just how far some of these contaminants have dispersed.
Case Study #1:
Southeast Missouri Lead District
Missouri is home to the largest lead concentrations in the world, which have been mined for over a century. The Big River Mine Tailings site in Park Hills, Missouri has an HRS score of 84.91, the highest hazard ranking score of any superfund site in the country. This site includes eight enormous piles of mining waste totaling approximately 110 square miles in size. These piles, like the one seen in the photo below, are heavily contaminated with lead and other heavy metals.
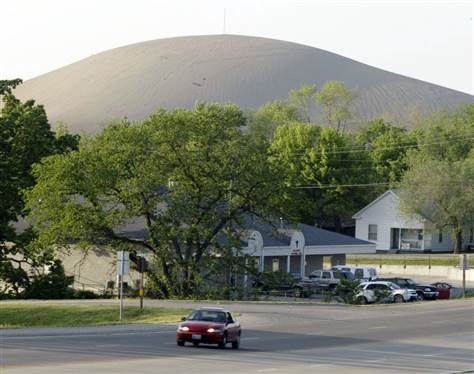
Photo Credit: James A. Finley / AP
Source: EPA
Over time, heavy metals and toxic chemicals from these waste piles have leached into the groundwater, eventually draining into the Big River.
This process escalated in 1977, when approximately 50,000 cubic yards of this toxic waste was washed directly into the river during heavy rains. Any toxins entering the Big River have been carried downstream, contaminating sediment and floodplains.
Source: EPA
But this site is not the only site contributing to pollution in the Big River Watershed and surrounding area. There are five more defunct lead mines within the Big River watershed, and another just south. All of these sites are on the National Priority List, and have an HRS score of at least 50.
The piles of toxic mining waste at each of these sites are susceptible to wind and water erosion. Remediation efforts in cases like these usually begin by covering the waste piles to prevent any further erosion and subsequent distribution of toxic material. But by the time these sites were identified as Superfund sites and remediation could begin, the damage was already done.
Carried by wind, rain, human activity, and transported by way of the Big River, toxic mine waste has been distributed throughout this entire area, affecting soil, groundwater, and surface water. It was also not uncommon for homes and developments to be built overtop mine waste before the dangers of lead were documented. The total area affected by these seven Superfund sites covers four entire counties in Missouri.
Source: EPA
Next we will travel east to Massachusetts to investigate the second case study.
Case Study #2:
GE-Pittsfield/Housatonic River Superfund Site
The General Electric transformer plant sitting on the banks of the Housatonic River in Pittsfield, Massachusetts was once known as “one of the crown jewels of GE’s electrical infrastructure, high voltage testing, and defense contracting business.” The defunct plant is now proposed for the Superfund National Priority List, with an HRS score of 70.71.
The primary concern at this site is the prolonged use of polychlorinated biphenyls (PCBs) by the plant as a coolant in the manufacture of transformers. PCBs do not break down in the environment and are now known to cause both cancer and serious non-cancer health effects in humans and animals.
For decades until they were banned in 1979, PCBs leaked from piping throughout the GE plant into the ground, or were directly dumped into the Housatonic River and other areas around the campus. The enormous footprint left behind by the defunct 300-acre plant is now part of the clean-up area designated by this Superfund site.
The cleanup areas include various complexes making up the GE campus, in addition to properties located in the Housatonic's floodplain, a school, areas where the river was re-routed in the 1940s, and a half-mile reach of contaminated riverbanks and sediments in the East Branch of the Housatonic River.
But the PCBs that made their way into the Housatonic River did not strictly remain in this area.
Source: In Pittsfield, General Electric plant closures leave bitter memories and EPA
Over time, storms and floods have disturbed PCB laden sediment from the river bottom and soil from contaminated river banks, redistributing it further down the river and into floodplains. The “Rest of River” cleanup area included in this Superfund site covers nearly 125 miles from the confluence of the East and West Branches in Pittsfield to just before the Long Island Sound in Connecticut.
PCBs are persistent in the environment, resistant to degradation, and accumulate quickly in the body. Fish and wildlife throughout the Housatonic watershed have tested at very high concentrations of PCBs, and both Massachusetts and Connecticut have issued consumption advisories. Humans are also at risk for exposure by direct contact with contaminated soil or sediment, or consumption of agricultural products produced in the floodplain. Without any clean-up intervention, PCBs could remain present in the Housatonic River ecosystem for hundreds of years.
Source: EPA
We just visited some of the most hazardous Superfund sites in the county. A site must receive a hazard ranking system (HRS) score of at least 28.5 to be placed on the National Priority List, and the sites we just explored had HRS scores between 50 and 84.91. Superfund sites are contaminated places left over from decades of unregulated industrial manufacturing and other activities. Next we will explore the Toxics Release Inventory (TRI), which is responsible for tracking toxic chemicals that are currently being released into the environment.
Chapter Two:
Toxics Release Inventory (TRI)
The EPA also monitors active facilities all over the country that are currently releasing toxic chemicals into our air, water, and land under the TRI program. The TRI was established under the Emergency Planning and Community Right-to-Know Act (EPCRA) of 1986 after public concern grew over the 1984 Bhopal, India disaster, in which an American-owned Union Carbide pesticide plant released a cloud of highly toxic methyl isocyanate into the air, killing thousands of people. Then in 1985, another, although smaller, toxic cloud was released from a Union Carbide plant on the Kanawha River in West Virginia.
As of 2018 there are 21,603 facilities that report the release of a toxic chemical as part of the TRI program.
The TRI does not directly regulate these chemical releases, but rather hopes to incentivize companies into improving their environmental performance by tracking and publishing this data. Use the time slider below to explore total pounds released per year since reporting began in 1987.
Notice the big jump from 1997 to 1998. Seven industry sectors were added to the TRI in 1997, including metal and coal mining, electric power generators, and commercial hazardous waste treatment operations.
But size is not the only determining factor in how dangerous a chemical release is.
The Risk-Screening Environmental Indicators (RSEI) model is used to identify specific facilities or chemicals that may pose a greater risk. RSEI scores also consider a chemical’s toxicity, its fate and transport through the environment, and the size and location of the exposed population.
Chromium and chromium compounds posed the greatest risk in 2018, composing 39.1% of the country's total RSEI score.
Ethylene oxide comes in at a close second, composing 30.5% of the country's total RSEI score. Long term exposure to ethylene oxide can increase risk of lymphatic and breast cancers.
A medical sterilizer plant in the Chicago suburb of Willowbrook, Illinois was recently shut down after an EPA report found that ethylene oxide air emissions from the plant were increasing long-term cancer risks for people living up to 25 miles away from the facility. Sterigenics released 4,205 pounds of ethylene oxide in 2016. In response to public pressure, Illinois just passed legislation to phase out the use of ethylene oxide by 2022.
Texas houses the two highest emitters of ethylene oxide in 2018, with 57,090 and 42,822 pounds released each year, respectively. This is more than 10 times the amount released by the Sterigenics plant in Illinois. Releases in Texas are actually expected to increase in the wake of findings by the Texas Commission on Environmental Quality that increase safe exposure levels. These findings are in direct contradiction with the EPA, who recently found ethylene oxide to be far more hazardous than previously thought.
Source: Texas Revision to Ethylene Oxide Carcinogen Draws Concern
Louisiana has 13 ethylene oxide releasing facilities, eleven of which are located along the Mississippi River between Baton Rouge and New Orleans. The two highest emitters in Louisiana are located here and release 15,100 and 10,413 pounds annually.
St. James Parish is currently the only parish in this corridor between Baton Rouge and New Orleans that does not have an ethylene oxide emitting facility.
This will change if Formosa Chemicals wins the fight to construct a new complex near Sunshine Bridge in St. James Parish. The proposed 2,300 acre complex would be permitted to release up to 15,400 pounds of ethylene oxide annually, more than three times what was emitted at the now defunct Sterigenics plant in Illinois.
Source: The Advocate
Reassurances over the plant's safety do not ease residents who are concerned over Formosa's disreputable history.
An explosion in 2005 at Formosa's Point Comfort, Texas plant resulted in a fire that burned for 5 days and forced the community of Point Comfort into a shelter-in-place order. And in 2019 the company was ordered to pay a $50 million settlement to clean up plastic pellets and other pollutants they had been illegally dumping into Lavaca Bay and surrounding waterways.
Source: Lawsuit: Formosa's Negligence Caused Propylene Blast and The Texas Tribune
The Formosa Point Comfort Facility is owned by Formosa Plastics Corporation, which is headquarterd in Taiwan. Companies responsible for industrial pollution are often located far from the damage they inflict on communities.
The locations seen here represent the top 10 parent companies who own at least 90 facilities who report to the TRI.
Select a company from the dropdown to explore parent company headquarters in relation to the facilities they own.
Choose a companyWe just learned about the Toxics Release Inventory, and explored facilities and the toxic chemicals they release into our air, water, and land. Next we will wrap up this story by visiting West Virginia, where a chemical release in 1985 first helped fuel public outcry for the establishment of the TRI program.
Epilogue
We end in the Kanawha River Valley of West Virginia, or “Chemical Valley” as it known to some. This area has long been a site of mining and chemical production, and the 1985 chemical release that led to the establishment of the TRI was just one of many disasters that have occurred here over the years.
The latest disaster to occur here took place in 2014, when approximately 5,000 gallons of crude 4-Methylcyclohexanemethanol (MCHM) spilled into the Elk River, a tributary of the Kanawha River. MCHM is used as cleansing agent to remove impurities from coal that contribute to pollution during combustion. The spill originated from a storage tank at Freedom Industries, a chemical storage facility that does not qualify for TRI reporting.
This facility did not qualify for TRI reporting because it did not technically produce or release any chemicals, it only stored them.
Source: West Virginia chemical spill shines spotlight on loose regulation
The spill occurred upstream from the primary West Virginia American Water intake center, leaving 300,000 residents in nine counties without water for several days. The National Guard was called in to help distribute water as water bottles quickly disappeared from store shelves, schools and businesses shut down, and hospitals struggled.
The TRI tracks releases of chemicals into the environment, but how was a 46,000 gallon chemical storage tank sitting 1.5-miles up upstream from a water intake center overlooked? This incident emphasizes not only the importance of tracking chemicals being released into the environment, but also exposes flaws in the regulatory system and reminds us of our vulnerability to disasters such as these.
The same rivers we depend on for clean drinking water also tend to be ideal locations for many of these industries producing and releasing toxic chemicals. Facilities seen here are located with one-mile of a river.
The Superfund case studies showed us the lasting and widespread damage industrial pollution can cause when left unchecked. And while the TRI does track toxic chemical releases, it cannot always protect communities or the environment, especially if regulatory laws are not enforced. Industrial pollution is an issue that affects everyone, and we must continue to advocate for the health of our communities and our environment.
More resources: