Food Swamps
Mapping fresh vs. fast food options in Kentucky
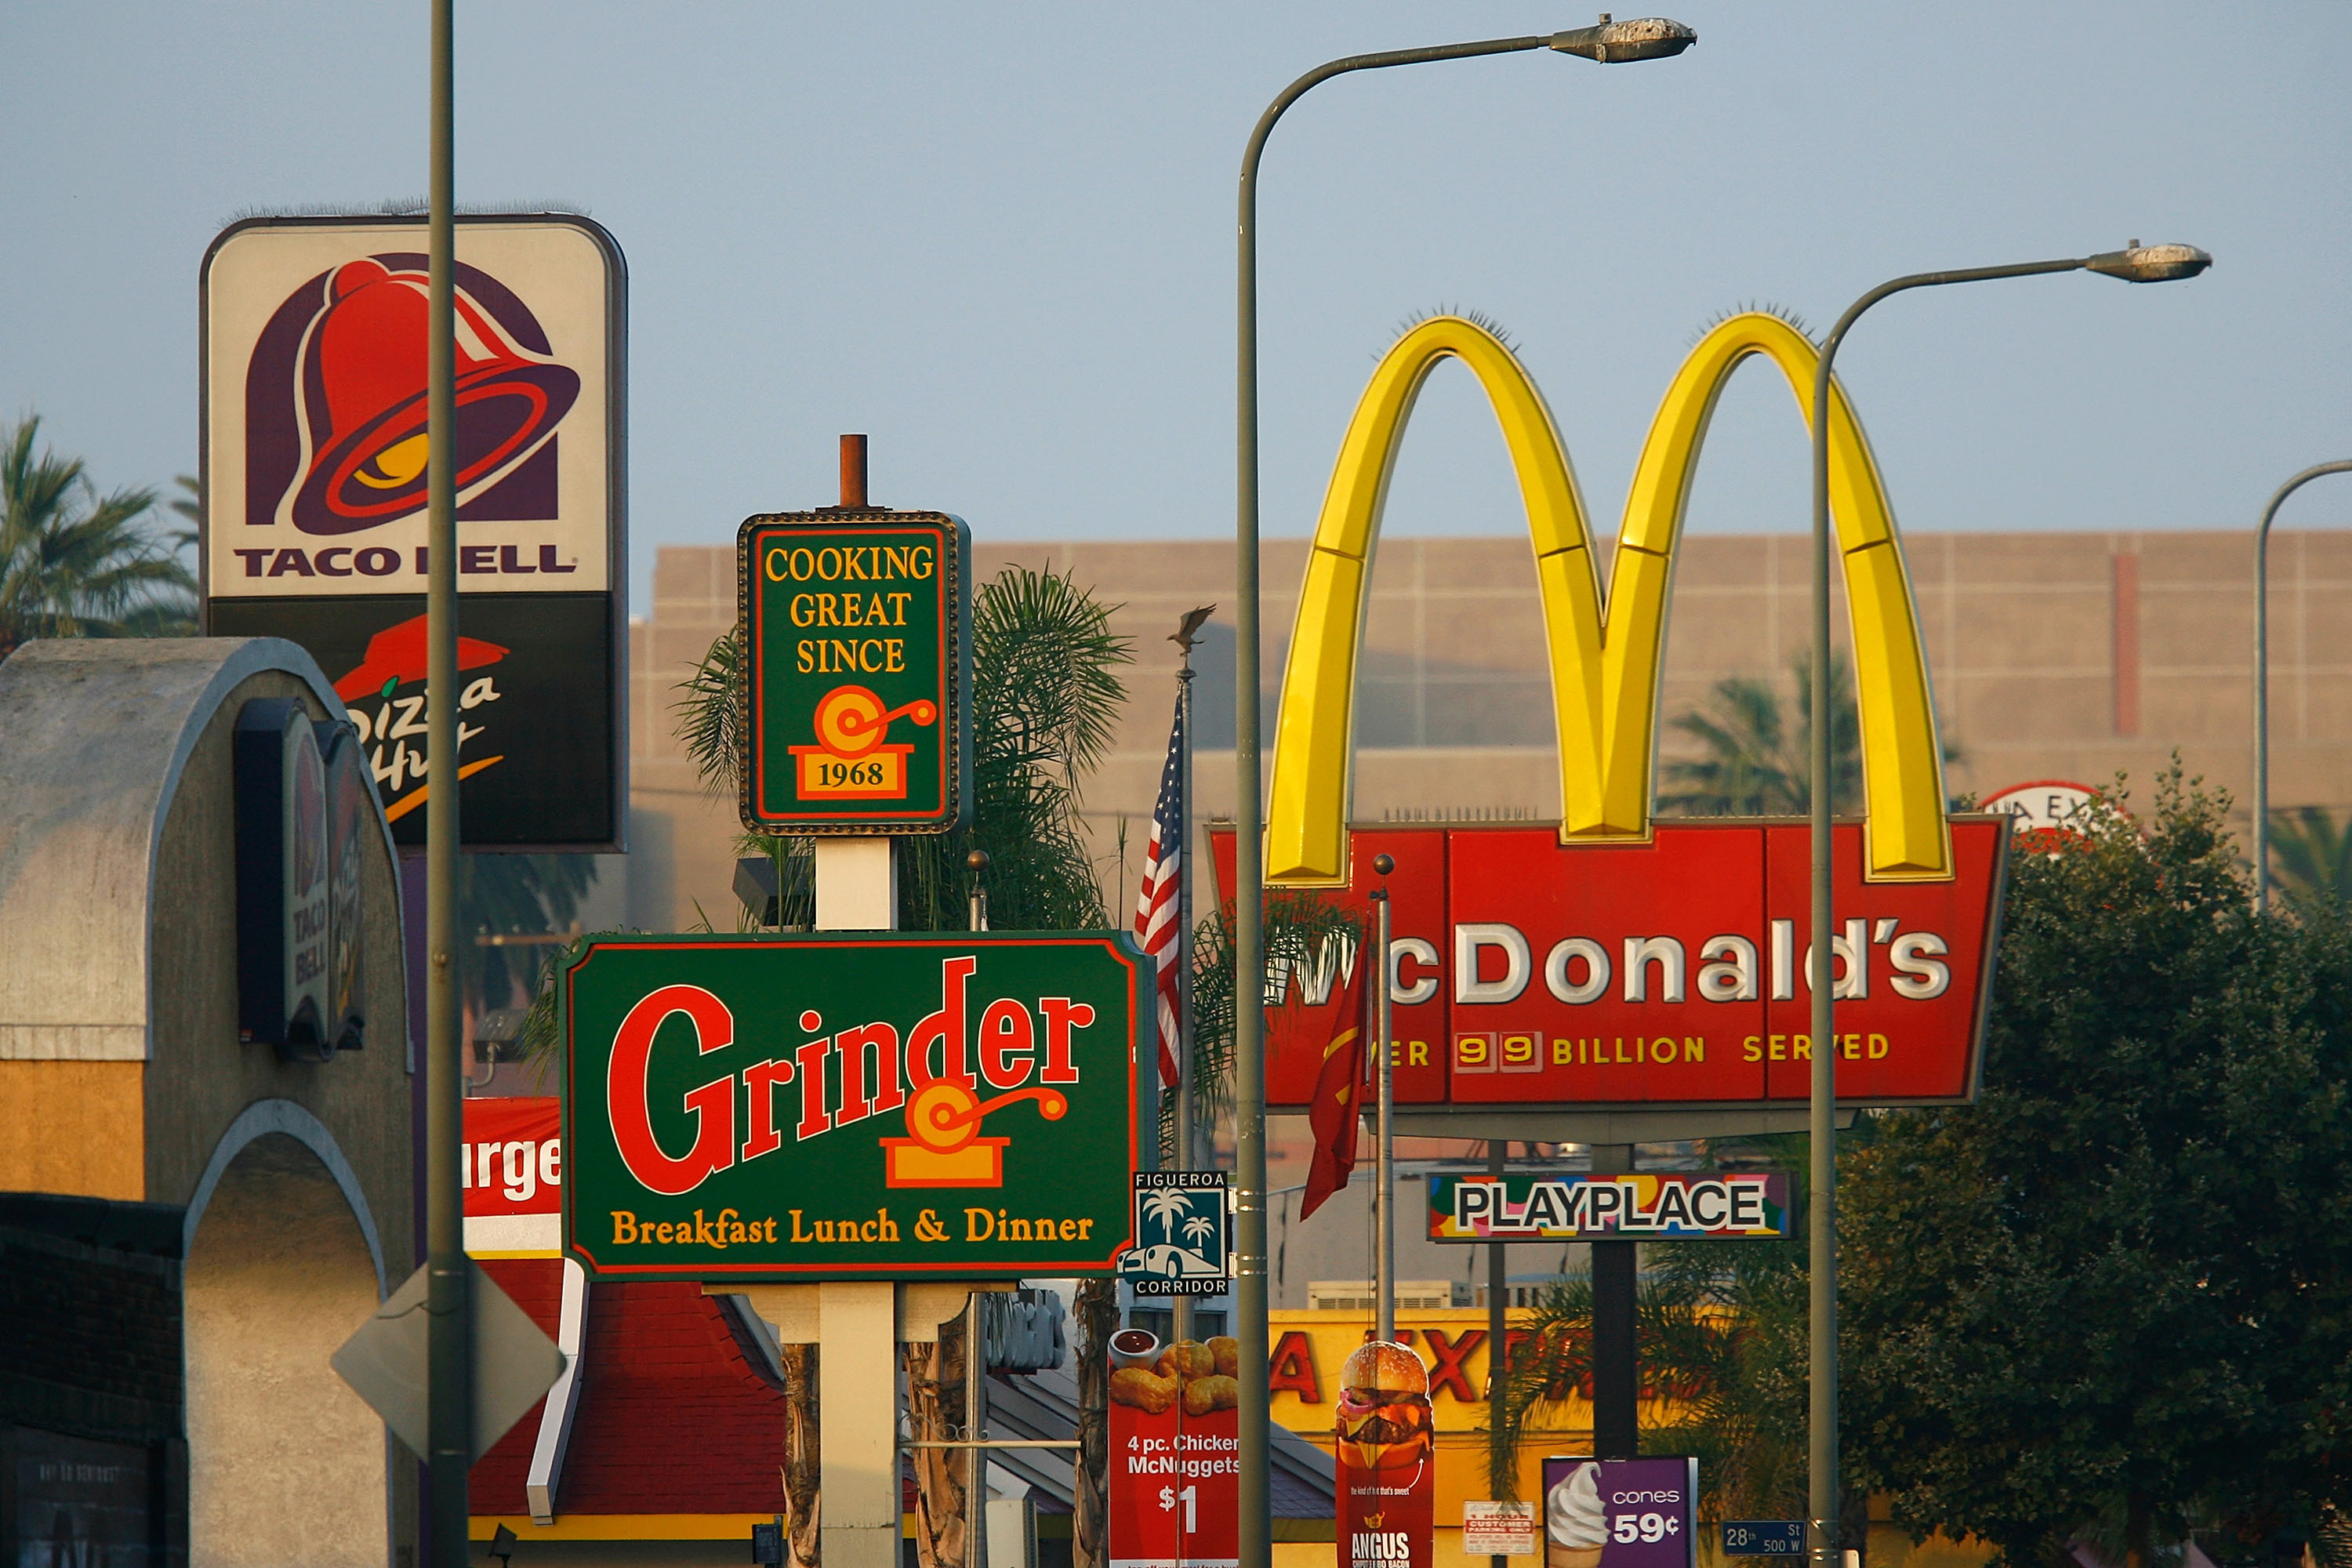
Areas densely populated with fast food restuarants and convenience stores, that also have a low concentration of grocery stores or supermarkets, are known as food swamps. It was once thought that food deserts, or regions that require travel of more than one mile to reach a fresh-food market, were the primary cause of high obesity rates in certain areas. However, recent research has suggested that better access to grocery stores does not necessarily improve a region's health as long as there is an excess of convenient fast food restaurants to choose from nearby.

(Photo by David McNew/Getty Images)
This map shows grocery stores and supermarkets, and fast food restaurants and convenience stores aggregated first by 20-mile hexabins, then 1-mile hexabins in Kentucky. The total number of grocery stores and supermarkets was subtracted from the total number of fast food restaurants and convenience stores in each hexabin, to show if each area had more fast food options or healthier supermarket options available. Zoom in on the map to explore more concentrated food swamps, and to see actual locations of fast food restaurants, convenience stores, grocery stores, and supermarkets.
Data source and method
Data was prepared in QGIS 2.18.16 on Windows 10, and mapped in Carto. Point features for supermarkets, grocery stores, fast food restaurants, and convenience stores were downloaded from Open Street Map, and combined into two layers, (1) supermarkets and grocery stores, and (2) fast food restaurants and convenience stores.
A 1-mile hexagon grid was created using the MMQGIS plugin, and each layer was joined by spatial location to the hexagon grid to find the total number of each per hexagon. The same was then done using a 20-mile hexagon grid. A new field 'Fast_food_minus_grocery_stores' was created in each hexagon grid, and the hexagons symbolized using a divergent color scheme to show whether an area had a higher concentration of fresh-food options or a higher concentration of fast-food options.
The 1-mile hexagrid shows food swamps present at the city level, while the 20-mile hexagrid shows more regional concentrations. Areas not covered by a hexagon can be assumed to have neither grocery store nor fast food restaurant, at least according to the data available.
- Map created by Eileen Grady in 2018
- Data acquired from © OpenStreetMap contributors
- Map inspired by "Food Swamps Are the New Food Deserts" by Olga Khazan (The Atlantic, December 2017)